
Broad equity finished mixed for the trading week.
- The S&P 500 was down for the week, falling -0.08%
- The Dow Jones Industrial Average fell by -0.08%
- The Nasdaq Composite finished up 0.24%
- The 10-Year Treasury closed at 4.39%
The Conference Board’s (CB) Consumer Confidence report was released towards the beginning of the week, showing a turn in the dwindling trend that has occurred since January. June showed a spike in confidence amongst consumers with a reading of 100.4, higher than anticipated.
Wednesday, weekly crude oil inventories were released by the Energy Information Administration (EIA). Oil inventories from the previous week returned higher than the forecasted number, depicting a weaker demand and potentially influencing decreases in the price of oil.
On Thursday, Q1 gross domestic product (GDP) came in slightly higher than expected, with GDP rising 1.4% versus the expected 1.3%. This is significantly lower than the previous Q4 2023 reading of 3.4%. This is below the U.S. target of 2%, but the slightly higher beat was a positive for investors.
Additionally, durable goods orders shed light into the industrial side of the U.S. economy. Durable goods orders were up 0.1%, versus the expected -0.5% for month-over-month, while core durable goods were down -0.1%, versus the expected rise of 0.2%.
On Friday, the Personal Consumer Expenditures (PCE) indices were released for May with both PCE and Core PCE, the Fed’s preferred inflation measure, coming in at expectations of 0.0% and 0.1%, respectively. Additionally, the year-over-year PCE Price index was in line with expectations at 2.6%.

Evolution and Dynamics of Private Equity Markets
Private markets have evolved significantly over the past decade, offering diverse investment opportunities in non-publicly traded assets. As of June 2023, these markets managed an impressive $13.1 trillion in assets, growing at nearly 20% annually since 2018 and adding $8 trillion since 2013. Notably, fundraising is not limited just to institutional players anymore. According to intervalfundtracker.com, there are currently 30+ registered funds, including both interval funds and tender offer funds, that provide accredited investors access to private equity investments. These funds collectively manage approximately $32 billion in assets under management (AUM) as of Q1 2024.
Private equity (PE) has been the dominant asset class in the private markets, accounting for about 50% of the private market index, which differs from public equity due to the lack of public trading and longer investment horizons.

PE encompasses three main strategies:
- Buyouts: Acquiring mature companies to improve value
- Growth/Expansion: Accelerating growth in established firms
- Venture Capital: Funding high-potential early-stage companies
While buyouts have traditionally dominated PE (95% in 2022), the growth/expansion sub-asset class has grown to approximately 15% over the past decade, according to Pitchbook. This shift reflects a trend of companies remaining private longer, attracting more growth-stage investments.
Private equity, unlike public markets, remains an opaque asset class with limited transparency and few service providers for the private wealth sector. While public equities possess extensive research, analysis, and analyst coverage across various sectors and investment styles, private equity lacks such comprehensive scrutiny.
The private equity industry faces headwinds such as high interest rates, economic uncertainty, regulatory challenges, and inflationary pressures, while benefiting from tailwinds including abundant dry powder (uncommitted capital), continued institutional investor demand, consolidation opportunities, potential retail investor access, and technological advancements that are collectively shaping strategies and investment decisions in the current market landscape. This spotlight aims to provide the private equity landscape by presenting key high-level metrics commonly used by research providers to track and analyze this enigmatic space.
At its core, private equity funds typically operate via a drawdown structure, managed by a general partner who raises capital from limited partners. Unlike public markets, private market opportunities require extensive due diligence and time. Uncommitted capital, known as “dry powder,” incurs fees without generating returns. This creates a J-curve effect: funds initially perform negatively due to fees and cash drag, but potentially offset losses when mature assets are sold near the fund’s end.

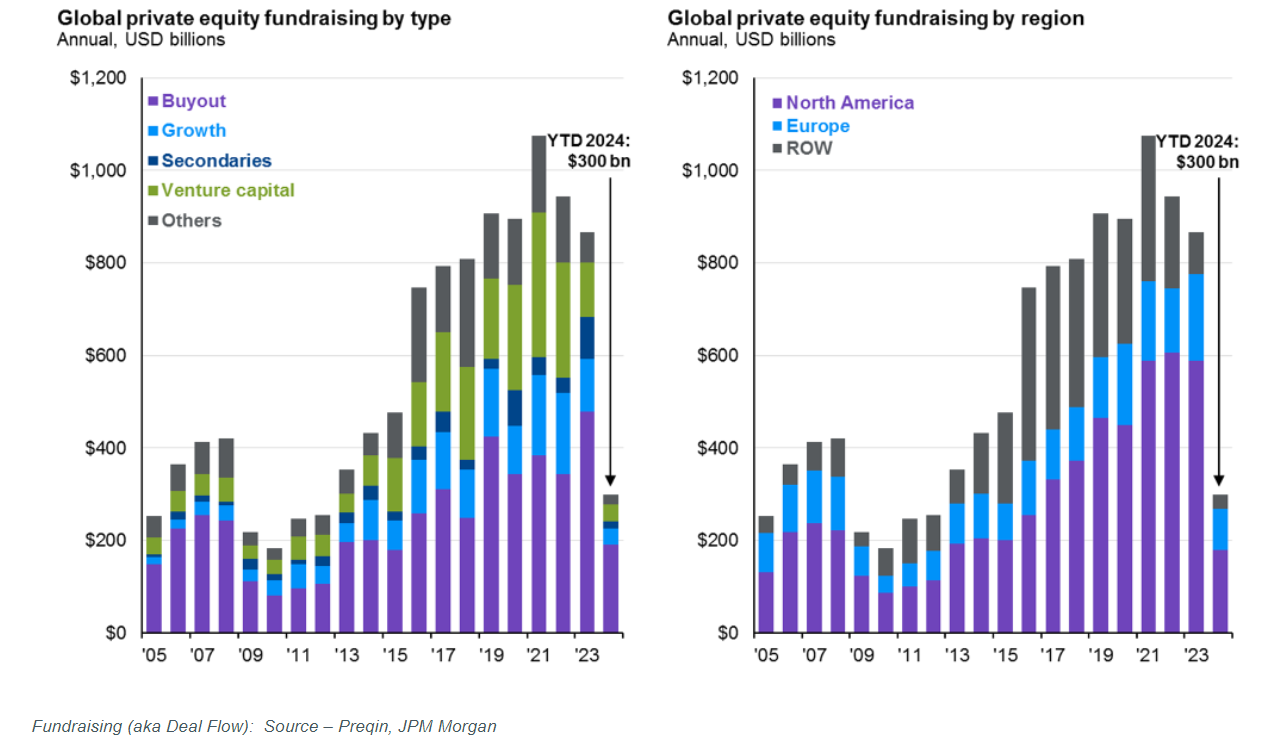
Preqin reports that global fundraising has declined since its 2021 peak, reaching $300 billion in Q1 2024. Buyouts and North America dominate strategies and regions, respectively. While North America remains the leading fundraising region, Europe has increased its market share this year.
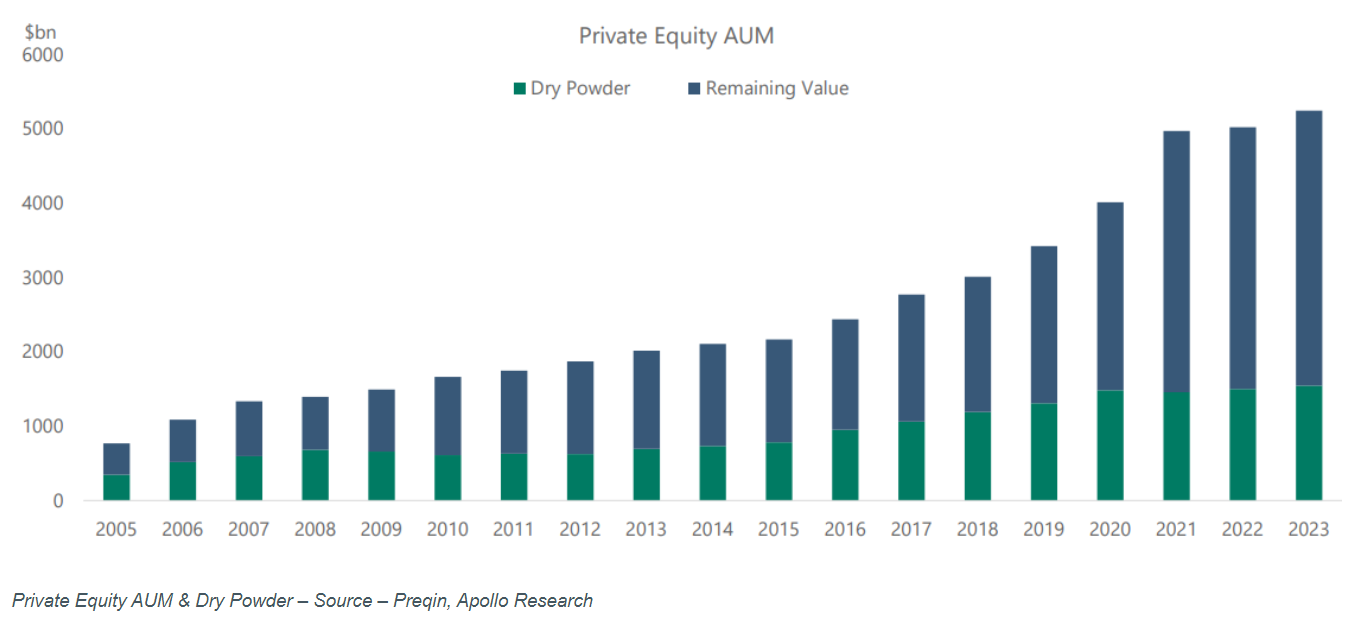
The global value of private equity assets reached approximately $5 trillion as of Q2 2023, including dry powder, according to Pitchbook. Dry powder has been growing due to challenging market conditions limiting deal activity and exits. While megafunds hold the largest share of dry powder, middle-market PE funds have seen an increase over the past decade, likely due to increased competition for deals in this segment and a shift in investor preferences towards more specialized strategies.

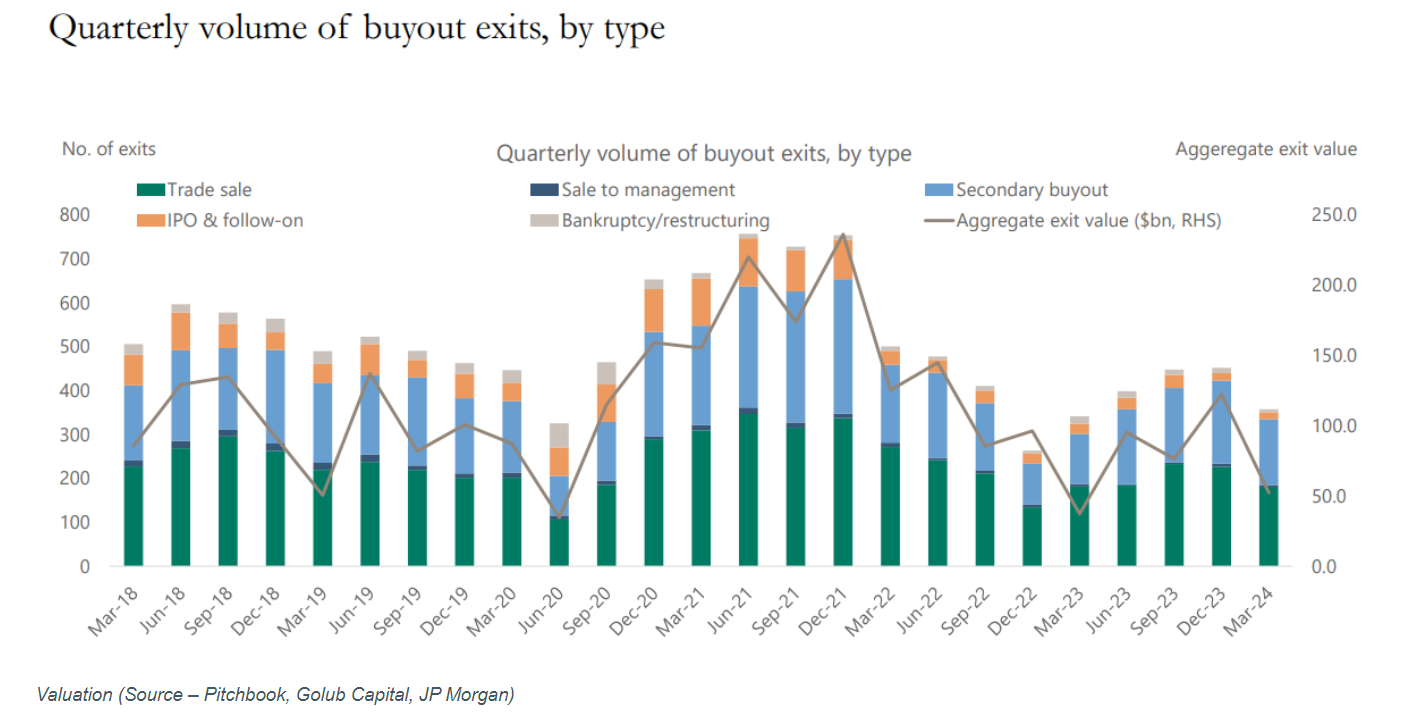
According to Preqin, the pace of buyout exits has been slowing down in the current market, despite a significant surge in both the number and value of exits in 2021. The primary forms of exit have been trade sales and secondaries. Trade sales involve either companies or their assets being sold to other companies, while secondaries occur when limited partners (LPs) or general partners (GPs) sell their stakes to other investors.

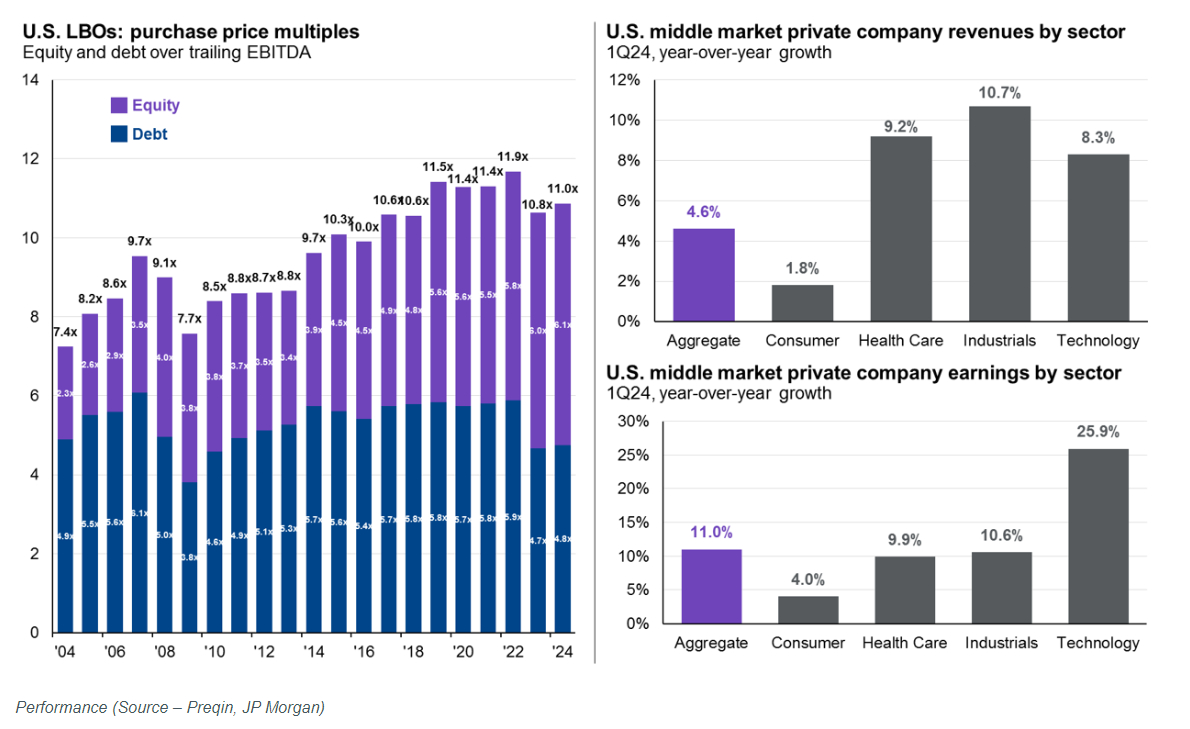
Analysis of the U.S. Buyout market, the largest PE sub-asset class, reveals a decade-long growth in purchase price multiples, peaking at 11.9x EBITDA for middle-market private companies in 2021, coincident with the peak in exits we discussed earlier. Rising debt multiples indicate sponsors’ increased willingness to leverage, supported by low default rates. Equity multiples continued to scale up over the last year, driven by strong economic activity and earnings growth. J.P. Morgan research attributes the past year’s revenue and earnings improvements primarily to the technology sector, with some contribution from industrials.

Manager selection is crucial in private equity due to significant performance dispersion. According to J.P. Morgan’s research, the gap between top and bottom quartile private equity managers can be as wide as 25 percentage points over a five-year period. This dispersion is particularly pronounced in certain segments, emphasizing the critical role of effective manager selection in maximizing private equity investment potential.

Turning the calendar to a new month of the year, the upcoming week will provide pertinent data points to facilitate consumers in understanding and interpreting the state of the U.S. economy.
The Manufacturing Purchasing Managers’ Index (PMI) and Services PMI for June will be released, providing an insight into where the economy currently is in the economic cycle. A reading above 50 suggests expansion for the industry, while a reading under 50 suggests contraction. Readings from the previous four months for both industries have shown indications of being in expansion territory.
Current labor market conditions will be showcased through the number of current job openings in the Job Openings and Labor Turnover Survey (JOLTS) measure for the previous month. Employers will report about their openings, new hires, and terminations for the month of May.
Markets will close early on Wednesday at 3:00 p.m. EST due to the upcoming national holiday, Independence Day. Additionally, markets will remain closed for the entirety of the day on Thursday and will reopen for trading on Friday morning.
Rounding out the week, the change in average hourly earnings will be released for June. A decrease in wages will signal economists to a potential contraction of the labor market. Alternatively, the U.S. Department of Labor will release the number of initial jobless claims to gauge the number of those who recently became unemployed, requiring unemployment insurance benefits. Additionally, the weekly U.S. Baker Hughes Total Rig Count will measure the number of active rigs, providing an insight into a possible increase or decrease in demand. The previous four readings have shown a slight decline in the number of rigs from the previous week. Economists will be watching to see if this trend continues.
This content was developed by Cambridge from sources believed to be reliable. This content is provided for informational purposes only and should not be construed or acted upon as individualized investment advice. It should not be considered a recommendation or solicitation. Information is subject to change. Any forward-looking statements are based on assumptions, may not materialize, and are subject to revision without notice. The information in this material is not intended as tax or legal advice.
Investing involves risk. Depending on the different types of investments there may be varying degrees of risk. Socially responsible investing does not guarantee any amount of success. Clients and prospective clients should be prepared to bear investment loss including loss of original principal. Indices mentioned are unmanaged and cannot be invested into directly. Past performance is not a guarantee of future results.
The Dow Jones Industrial Average (DJIA) is a price-weighted index composed of 30 widely traded blue-chip U.S. common stocks. The S&P 500 is a market-cap weighted index composed of the common stocks of 500 leading companies in leading industries of the U.S. economy. The NASDAQ Composite Index is a market-value weighted index of all common stocks listed on the NASDAQ stock exchange.
