
Broad equity finished mixed for the week with the style rotation trade in full effect.
- The S&P 500 was down for the week, losing 1.97%
- The Dow Jones Industrial Average was up by 0.72%
- The Nasdaq Composite was down by 3.65%
- The 10-Year Treasury closed at 4.25%
The week got off to a strong start with Federal Reserve Chair Jerome Powell providing market participants with a stronger indication that a rate cut may be coming soon, possibly in September. On Tuesday, core retail sales, which are a measure of consumer spending, were released for the month of June. The reading showed an unexpected break in the negative trend for the retail sector with a positive increase of 0.4%. This was taken as an indication of a strong consumer, despite persistent high inflation.
Wednesday provided an outlook into crude oil inventories, with the Energy Information Administration totaling a large decrease in the number of holdings of commercial crude. This decrease indicated a strong demand for oil. Thursday, the number of initial jobless claims provided an insight into the health of the U.S. labor market. The past week showed a large increase of 9% in the number of initial claims for unemployment insurance, stipulating a weakening labor market. That same day, the Philadelphia Fed Manufacturing Index was released, providing context into manufacturing conditions, and its implications on inflation. July has shown itself to be a positive month for the sector, indicating a large increase in its conditions due to a large spike in the reading of 13.9, compared to the previous reading of 1.3.
To end the week, traders heard from the New York Fed President Williams, followed by the Atlanta Fed President Bostic. While Chairman Powell has the most say over rate decisions, the two Fed presidents provided more context as to the possible rate cuts on the horizon.

The Economic Reality for Gen Zers and Millennials
Today’s Gen Zers and Millennials are facing different challenges than their parents did during this period of life. There are many realities, including economic ones, they face when entering adulthood. However, the current economic landscape has had particular headwinds for this age group which we will explore this week.
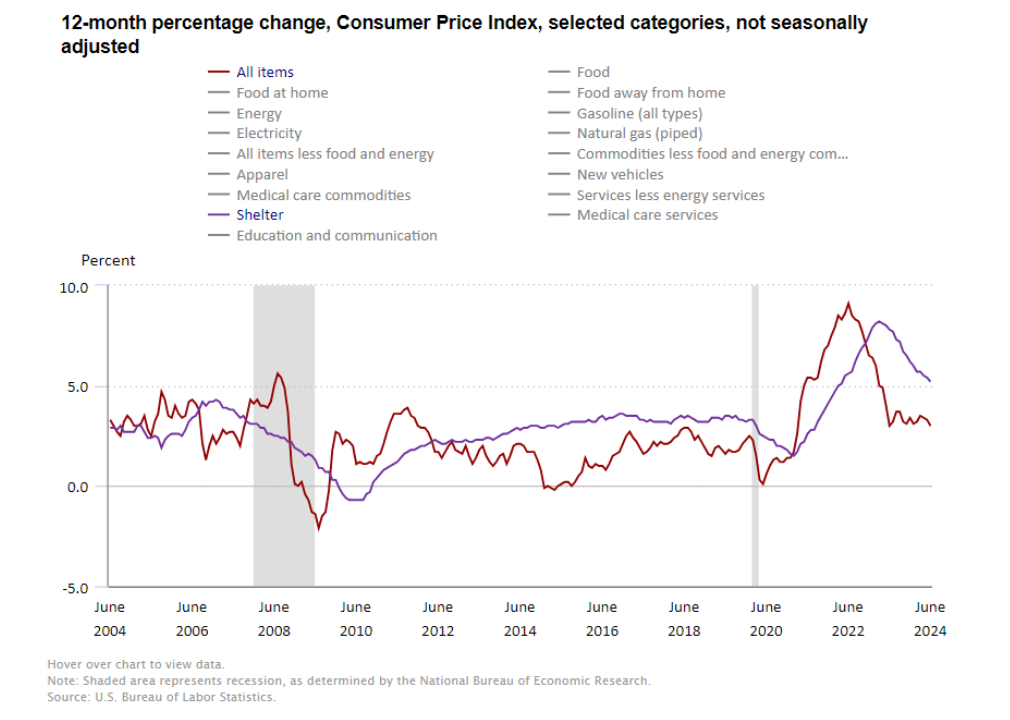
Currently, wages have not been keeping pace with inflation, while the percentage of income used on housing has increased over time based on the Consumer Price Index (CPI). Post-recovery from the housing recession in 2008, housing expenses started to moderately increase. Following COVID, the amount of income spent on housing began to skyrocket and has stayed higher than the traditional CPI for longer. This has left consumers with the reality of a continuous increase in their monthly housing expense from their monthly paycheck.


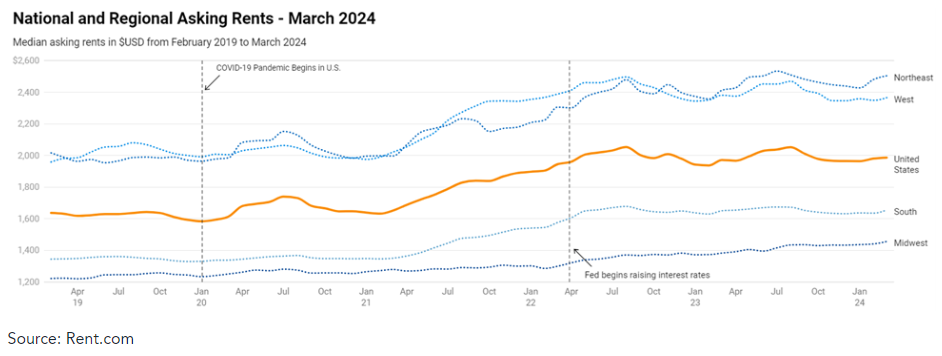
When it comes to renting, Gen Zers and Millennials are faced with the reality that owning their own home is unattainable. According to Rent.com, U.S. rent prices have grown from about $1,600 in January 2020, to about $2,000 in January 2024. While there were moderate gains in March, more substantial rent growth continues to be hindered by high housing costs which are retaining potential homebuyers in the rental market.

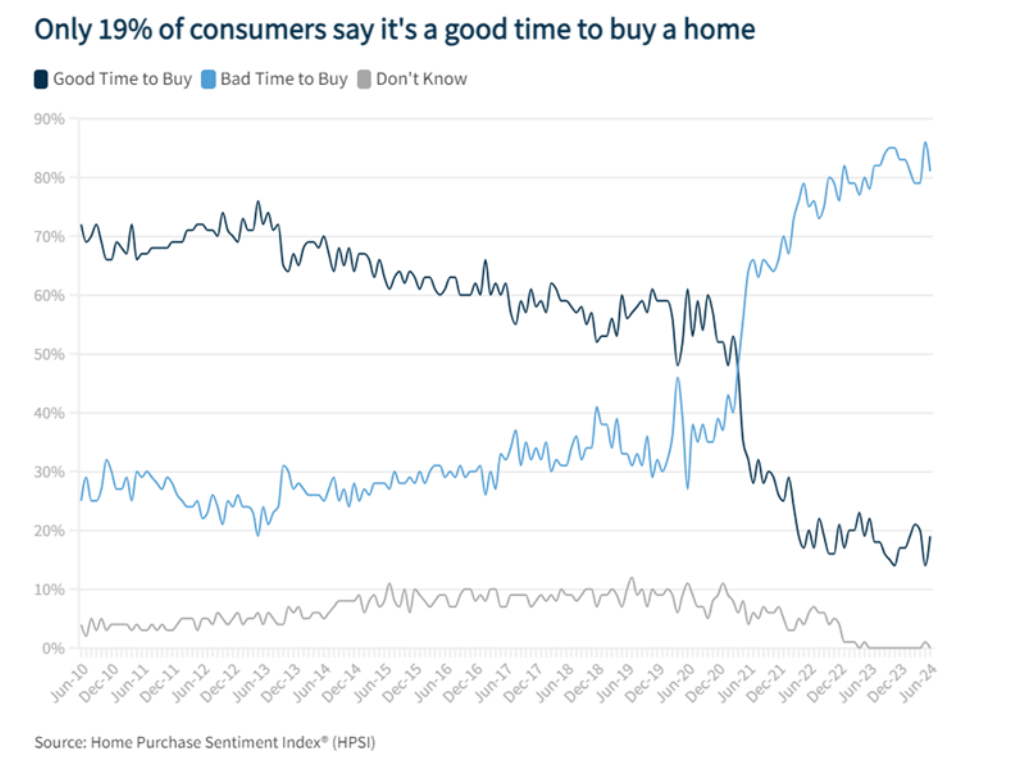
Additionally, mortgage rates, which have a strong impact on the market, remain elevated while there is also a lack of housing inventory for homebuyers which has led to higher housing price increase since 2020. At the same time, insurance costs and property taxes have also increased substantially due to the increased home value and replacement costs, putting further financial pressure on those looking to purchase a home and pricing many homebuyers out of the market. Since the start of the pandemic, the monthly principal and interest (P&I) payment of a for-sale home has more than doubled. Therefore, consumers have a consensus that this is not the time to buy and are mostly staying put in hopes of a better housing market in the future.

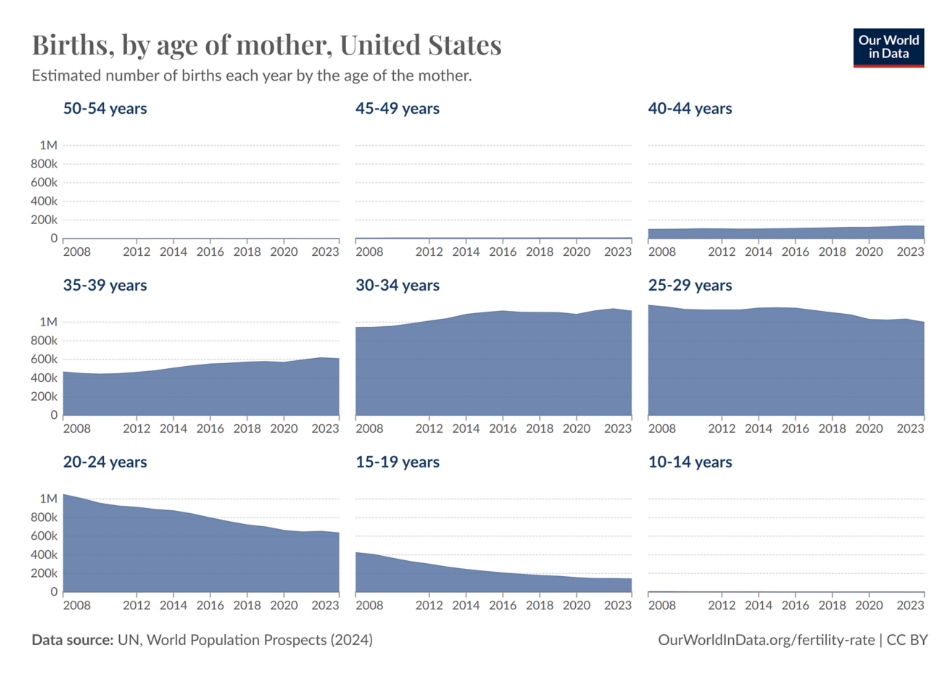
Due to these factors, Credit Karma reported that 31% of Gen Z live at home with a parent or family member, 24% of renters in America say they can no longer afford their rent, and 38% of renters are sacrificing necessities to pay their rent, including older generations. Household formation has suffered as some families have put off having children due to their personal economic condition. According to Our World in Data, since 2020, American birth rates among Gen Zers and Millennials have somewhat moderately declined.

As higher costs for housing have led to less homeowners within the Gen Z and Millennial age group, declining birth rates could lead to a drag on long-term economic growth. While policies such as increased immigration in recent years have dampened the effects of an aging population, Gen Z and Millennials’ struggles with household formation could affect long term growth as well as overall economic activity.

Looking forward, the U.S. existing home sales numbers will be released on Tuesday. The number gauges the demand in the U.S. housing market and is one way to examine the health of the housing market. The following day, the new home sales number, which will include all residential buildings not listed in the previous release, will be reported.
Wednesday brings the Manufacturing and Services Purchasing Managers’ Indices (PMIs), examining whether the trends in these data points will continue, or if new data will buck the trend. Both surveys have had neutral to positive readings since early 2024, indicating that business conditions are neutral to improving for both manufacturers and service firms.
Thursday will bring the U.S. gross domestic product (GDP) into the spotlight, the broadest indicator of the strength of the U.S. economy. Initial jobless claims will be released simultaneously, indicating the health of the U.S. jobs market. Combining that data with Friday’s release of the Personal Consumption Expenditures (PCE) Index, a Fed-favored inflation measure, will allow investors to get a read on the economic story for the latter half of 2024. Bulls will be looking for a Goldilocks balance of economic data, a moderate-but-healthy GDP figure, an in-line jobless claims number, and a soft inflation reading, all of which will pave the way for continued talks of rate cuts.
This content was developed by Cambridge from sources believed to be reliable. This content is provided for informational purposes only and should not be construed or acted upon as individualized investment advice. It should not be considered a recommendation or solicitation. Information is subject to change. Any forward-looking statements are based on assumptions, may not materialize, and are subject to revision without notice. The information in this material is not intended as tax or legal advice.
Investing involves risk. Depending on the different types of investments there may be varying degrees of risk. Socially responsible investing does not guarantee any amount of success. Clients and prospective clients should be prepared to bear investment loss including loss of original principal. Indices mentioned are unmanaged and cannot be invested into directly. Past performance is not a guarantee of future results.
The Dow Jones Industrial Average (DJIA) is a price-weighted index composed of 30 widely traded blue-chip U.S. common stocks. The S&P 500 is a market-cap weighted index composed of the common stocks of 500 leading companies in leading industries of the U.S. economy. The NASDAQ Composite Index is a market-value weighted index of all common stocks listed on the NASDAQ stock exchange.
